In this edition of Leveraged Trader Success Stories, we spotlight a trader who proved that a setback is just a setup for a comeback. Momentum in trading is a powerful thing, and this trader has harnessed it perfectly which is in contrast with other trader success stories that focus on long-term grinds. This story is a testament to the power of momentum and the unique advantage of the Leveraged Refuel feature. After a previous funded account breached the risk limits, this trader didn’t waste time retaking another challenge. Instead, they utilized the Refuel option – paying the activation fee to instantly access a fresh $100,000 Funded Account without retaking the evaluation.
The result? Just 10 days after receiving their first payout of $5,804.50, they turned this fresh Refuel account into another $5,225.00 profit share.
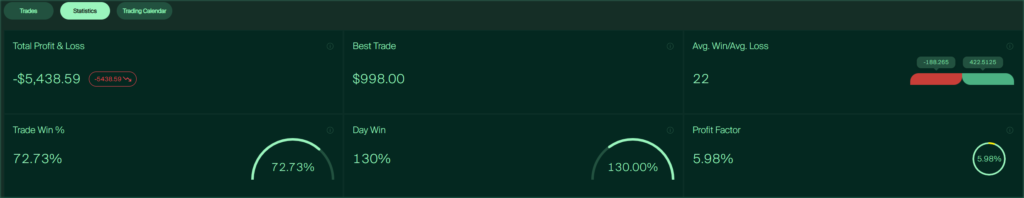
This brings their total withdrawn profits to over $11,000 in less than two weeks. What makes this run remarkable isn’t just the money – it’s the surgical precision. With a Profit Factor of 5.98, this trader didn’t just beat the market; they dismantled it. While their first run was impressive, today we are going to analyze the trading history of their second payout (the Refuel account), which displayed a level of surgical precision rarely seen in the markets.
$11,029 IN TWO PAYOUTS
First payout: $5,804. Refueled instantly. Second payout: $5,225 in just 10 days. The Gold specialist who achieved a 5.98 Profit Factor with 72.73% win rate across 22 surgical trades during the holiday season.
Second Payout
$5,225
10 Days From Refuel
Profit Factor
5.98
$6 Made Per $1 Lost
Win Rate
72.73%
16W / 6L
Trade Volume
22
Surgical Precision
01 // THE REFUEL ROCKET
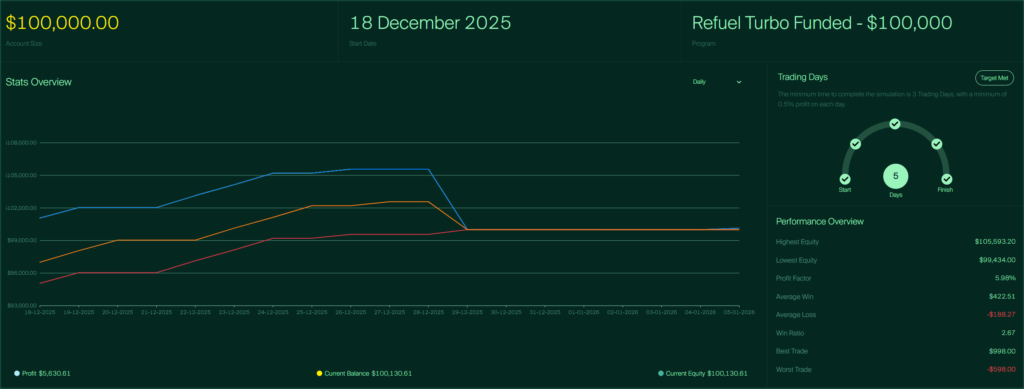
Dec 18-29: From $100,000 to $105,593 in 10 days. The sharp drop at the end is the $5,225 payout withdrawal. Notice the stair-step ascent—this is what momentum looks like.
02 // THE $1K/DAY MACHINE
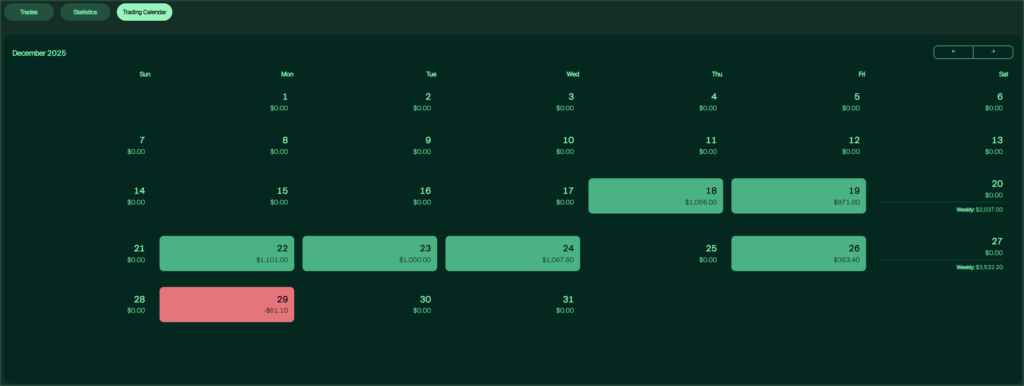
6 consecutive green days. 5 days hitting almost exactly $1,000—evidence of strict daily profit targets. Only 1 red day: -$61 (0.06%).
03 // ASIAN SESSION HUNTER
Most trades executed 00:00-06:00 server time. Lower volatility, thinner spreads, cleaner price action. Trading while the West sleeps.
04 // THE HOLY GRAIL: HIGH WR + HIGH RR
Most traders compromise: high win rate with small wins, or low win rate with big wins. This trader achieved both. 72.73% win rate AND winners 2.24x larger than losers.
05 // LESS IS MORE: 22 TRADES
$5,225 profit from 22 trades = $237 per trade average. High-probability setups at specific times yield better results than constant trading.
The Journey: The “Refuel” Rocket
The Equity Curve for this funded prop account is the definition of efficiency. Since the Refuel account allows traders to start earning from Day 1, there was no “warming up” period. Starting on December 18, the curve moves upward in a decisive, stair-step fashion. There is almost no “drawdown drag.”
The Withdrawal Event: The sharp drop you see at the end of the chart (around Dec 29) is the $5,225 payout leaving the account. What’s interesting is the timeline. The bulk of the profits were generated between December 22 and December 26 – a holiday period where many traders struggle with thin liquidity. This trader, however, used that volatility to their advantage. While most traders bleed capital due to thin liquidity and erratic spreads during Christmas week, this trader used that exact market environment to their advantage. They didn’t just survive the holiday chop; they hunted in it.
Visualizing Perfection: Inside the Trading Calendar
When we look at the Trading Calendar, the consistency of this second run becomes undeniable. This wasn’t a case of one lucky trade; it was a daily habit of winning. The Green Streak: From December 18 to December 26, the trader posted 6 consecutive winning days:
- Dec 18: +$1,066.00
- Dec 19: +$971.00
- Dec 22: +$1,101.00
- Dec 23: +$1,000.00
- Dec 24: +$1,067.80
- Dec 26: +$363.40
The “Flawless” Run: Notice the uniformity of the wins. For five straight days, the trader banked almost exactly $1,000 per day. This suggests a very strict daily profit target – once they hit $1k, they likely stopped trading, they walked away, refusing to give profits back to the market. The only red day on the calendar is December 29, with a negligible loss of -$61.10. This tiny loss occurred right before the payout request and had zero impact on the final result.
The Mathematics: A Profit Factor of 5.98
In our previous trader success stories, we’ve seen high win rates with negative RRR, or low win rates with high RRR. In our previous analysis of the 73% Win Rate Gold Scalper, we saw how a high win rate can sometimes mask a negative Risk-Reward Ratio. However, this trader achieved the ultimate goal: High Win Rate + High RRR. The stats for this second trading payout are statistically elite.
- Profit Factor: 5.98 (For every $1 lost, nearly $6 was made).
- Win Rate: 72.73%.
- Average Win: $422.51.
- Average Loss: -$188.27.
The Edge: This is statistically elite trading performance. Winning over 70% of the time is hard enough. The trader won nearly 3 out of 4 trades, and when they won, the profit was 2.2x larger than their average loss. They achieved this with low volume – only 22 trades were executed to secure the $5,225 payout. This wasn’t “spray and pray” scalping; this was sniping.
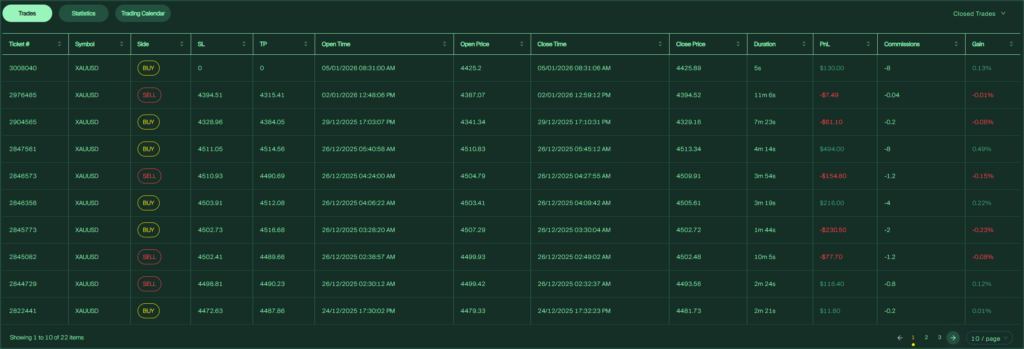
Asset Choice: The Gold Specialist
There is zero ambiguity in this trading strategy. Unlike the Multi-Asset “Market Rover” we recently profiled who traded 9 different instruments (Forex, metals, stock indices and crypto), this trading history shows one symbol and one symbol only: XAUUSD (Gold). By focusing exclusively on Gold, the trader developed a deep intuition for its intraday movements.
- Style: Scalping.
- Duration: Most trades lasted between 2 and 5 minutes.
- Timing: The trader capitalized heavily on the Asian and European opens (00:00 – 06:00 server time), avoiding the higher volatility of the late US session.
However, the real secret lies in the timing. A significant portion of trades occurred during the Asian Session. Gold volatility is typically lower during Asian hours compared to New York. This trader essentially found an edge in “fading” moves or scalping thin liquidity breaks while the rest of the Western world was asleep. They achieved this result with low volume – only 22 trades were executed to secure the payout. This wasn’t “spray and pray” scalping; this was sniping.
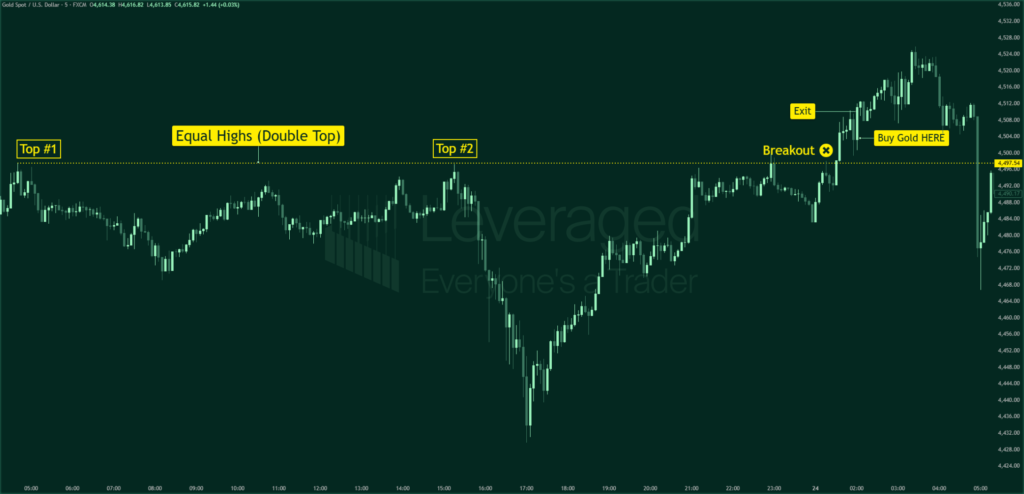
Case Study: The 5-Minute Christmas Eve Liquidity Hunt (+$998)
On December 24, just before the holiday liquidity dried up, the trader executed their best trade of the cycle – which occurred on a day where most traders expected thin liquidity. This trade is a masterclass in market structure.
- Ticket: #2797187
- Asset: XAUUSD (Buy)
- Result: +$998.00

Normally, Christmas Eve features thin liquidity and dead markets (furthered by a shortened trading session). However, Gold is currently in a historical super-cycle. Gold, driven by global economic concerns, had been trading at all-time highs. Even with thin holiday liquidity, volatility was still elevated. The Technical Setup (Equal Highs): The trader didn’t just guess; they waited for a strategic “Liquidity Hunt” above the previous day’s high which wasn’t just a random level – it formed a clean intraday Equal High (Double Top). In modern trading, equal highs act like a magnet because they trap retail stop-losses.
The trader showed extreme patience, waiting until Gold broke above the equal highs, respectively above the previous day’s trading range, capitalizing on the momentum breakout. The moment Gold breached those equal highs the trapped liquidity triggered a massive momentum breakout. The trader instantly capitalized on this surge to bank nearly $1,000. This scalp secured nearly 1% of the account in two minutes. It showcases the power of catching the initial burst of momentum at the market open and getting out before the spread widens.
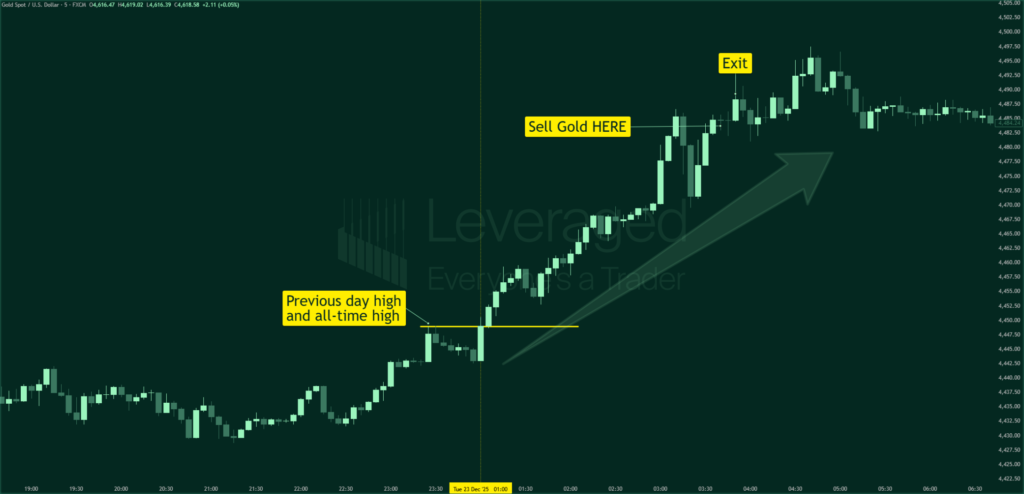
The “Worst” Trade: Fighting the All-Time High
With a Profit Factor of 5.98, there weren’t many bad trades. However, looking at the “Worst Trade” gives us insight into their risk management. To truly appreciate this trader’s psychology, we must look at the day before the best trade. On December 23, they took their biggest loss.
- Ticket: #2771546
- Asset: XAUUSD (Sell)
- Result: -$598.00
The trader shorted Gold. He was wrong for three main reasons. First, he was fighting a parabolic trend: The day prior (Dec 22), Gold had shattered the October 20th record to print a new All-Time High (ATH). That momentum naturally carried over into the next day.

Second, right at the daily open, Gold broke the previous day’s high and continued to trade higher into the Tokyo trading session. The trader thought the market looked “overextended” and tried to call the top by shorting and chasing a high. Lastly, he had a wrong bias. He sold into a market dominated by bullish momentum. He was fighting the trend. Rather than trading the breakout to the upside, he sold right into the middle of a powerful intraday momentum run.
The Lesson: The market had no mercy and continued to rocket upward. However, this trade highlights the trader’s greatest strength: They cut the loss in 11 minutes. They realized they were wrong, took a -$598 loss (only 0.6% of the account), and stepped away. Because they didn’t panic, they were able to return the very next day with a clear head to execute their perfect Christmas Eve winner. This proves the oldest saying in trading: “The trend is your friend.” While -$598 is a loss, it is roughly 0.6% of the account balance. Because they kept their losses under 1% strictly, they preserved their capital for the winning streak that followed on Dec 24 and 26.
Trader Success Stories: What Traders Can Learn
- The Power of Refuel: The most critical lesson here is resilience. After a previous account breach, this trader used the Refuel feature to skip the evaluation phase and get back into the live markets instantly. The ROI on the Refuel activation fee was massive, turning a small fee into a $5,225 payout.
- Momentum is Real: This trader secured a payout, Refueled, and immediately secured a second payout. When you are “seeing the market” clearly, don’t stop. Press your advantage.
- Master One Asset: We have seen Generalists, Grinders, and Scalpers. This trader is The Specialist.By trading only Gold, the trader didn’t get distracted by noise in Forex or Crypto. They knew exactly how XAUUSD moves during the Asian session and exploited it repeatedly.
- The Power of “Less is More”: This result was achieved with only 22 trades. You don’t need to be in the market 24/7. Waiting for the high-probability setups (like the market open) yields a far higher Profit Factor than over-trading.
- Daily Targets Work: The Trading Calendar reveals a clear pattern: the trader aimed for ~$1,000 per day. Having a daily profit target helps you know when to walk away, preventing “over-trading” and protecting gains.
- Trade When Others Won’t: While most traders were taking time off for the holidays, this trader recognized that price action still happens. By adjusting their trading strategy to the thin liquidity of late December, they banked $5,000 while others were on break.
- Never Short an All-Time High: As the worst trade showed, trying to predict the top of a parabolic market is dangerous. However, if you do get trapped, cut the loss immediately. The goal is to survive your mistakes so you can catch the next setup.
Conclusion
Securing $11,000 in payouts across two accounts in just 10 days is a life-changing performance for many. This trader combined the aggression required to trade Gold with the discipline required to maintain a 5.98 Profit Factor. It serves as proof that the Leveraged Refuel program is the perfect vehicle for traders who are ready to get back in the game and capitalize on their hot streaks immediately. They prove that you don’t need to trade 10 pairs or execute 300 trades to make money. You need one asset, one specific time window (Asian Session), and strict trading discipline. This is the cleanest, most professional equity curve of the trader success stories we have analyzed so far.
Whether it was the holiday timing, the Asian session focus, or the instant access via Refuel, every element of this trading strategy was optimized for one thing: Results. If you enjoyed this analysis, be sure to read about the Statistical “Holy Grail” trader who hit a 75% Win Rate on Nasdaq, as they share a similar commitment to mathematical precision.
Disclaimer: The analysis provided in this article is based on a retrospective look at the charts and represents the personal opinion of the author. At Leveraged, we do not dictate specific trading strategies. Our traders maintain full autonomy over their trading style and decisions, provided they operate within our Risk Management parameters and Terms & Conditions.