Free Candlestick Patterns Cheat Sheet (With Success Rates and Bonus Charts)
Feb 17, 2025 /Level: Beginners /Avg reading time: 10 minutes
If you trade frequently, mastering this Japanese candlestick patterns cheat sheet is a completely essential requirement.
With this article you will improve your trading analysis using our proprietary candlestick patterns cheat sheet and learn to recognize key bullish, bearish, and neutral candle formations that indicate potential trend reversals or continuations to become a better trader. Understand their price structures, typical setups, and how profitable each candlestick pattern is. That way, you can make much better trading decisions.
If you know the theory behind the Candlestick you can scroll down to the Candlestick Patterns Cheat Sheet PDF 2025.
Why are candlestick patterns so important?
These chart formations are not just lines on a screen – they show the constant struggle between the buyers and sellers, helping you predict trend reversals before they happen or trend continuation. This is the kind of edge you need when trading with larger sums of money, whether it’s your own or the firm’s capital. This edge is what separates successful traders from the rest, and it’s a key factor we look for at Leveraged.
When you look at various price charts, candlestick patterns offer a quick insight of market sentiment or the supply and demand imbalances in the market. Patterns like the Doji candlestick and the bullish engulfing pattern offer precise entry and exit signals, while simultaneously improving your risk exposure. This candlestick patterns cheat sheet will walk you through the most reliable candlestick patterns, their success rates, and how to use them effectively. And remember, consistent profitability, demonstrated through skills like candlestick pattern analysis, is key to securing and maintaining funding from a prop firm like Leverage, and progressing towards becoming a Senior Portfolio Manager.
And, as a bonus you get instant access to the candlestick patterns PDF download.
Let’s dive in!
So…What are Candlestick Patterns?
A candlestick is a visual representation used in financial charts showing how the price in markets like stocks, forex, cryptocurrencies, etc. moved over a specific period of time.
Let’s break down the basics.
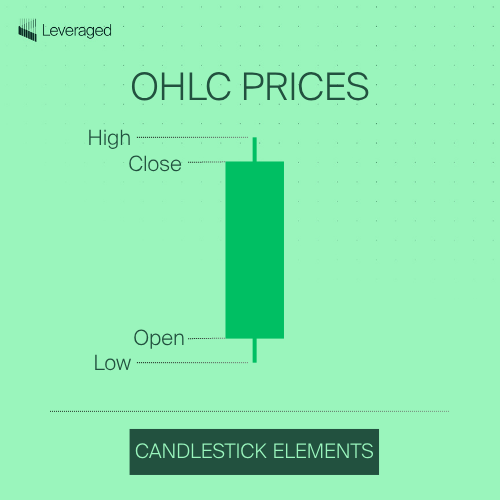
Every candlestick has 4 prices Open, High, Low, and Close prices, for short OHLC:
- Open Price: The price at which trading began for the period.
- Close Price: The price at which trading ended for the period.
- High Price: The highest price reached during the period.
- Low Price: The lowest price reached during the period.
The Anatomy of a Candlestick
A candlestick might look simple, but every component holds valuable information about price movement. Let’s break down the 2 main components of a Japanese candlestick:
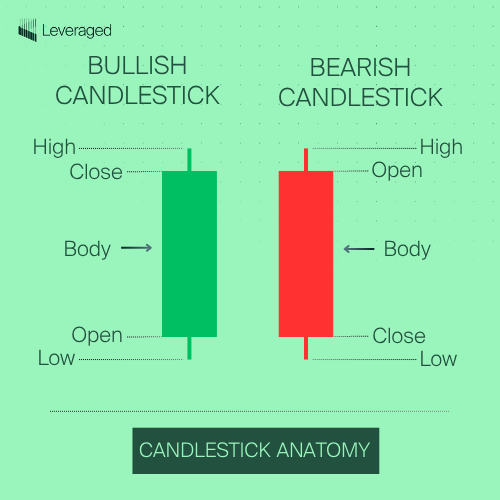
First, we have the body (the real body): This is the wide, rectangular part of the candlestick. It represents the difference between the opening price and the closing price for the period (Eg. a day, 1 hour, 15 minutes, etc.):
- Green/White Body (Bullish): If the body is green (or sometimes white, depending on your charting platform), it means the closing price was higher than the opening price. The bulls won the battle! This indicates buying pressure and potential upward momentum. The longer the green body, the stronger the buying pressure.
- Red/Black Body (Bearish): If the body is red (or black), the closing price was lower than the opening price. The bears are in control! A longer red body indicates stronger selling pressure.
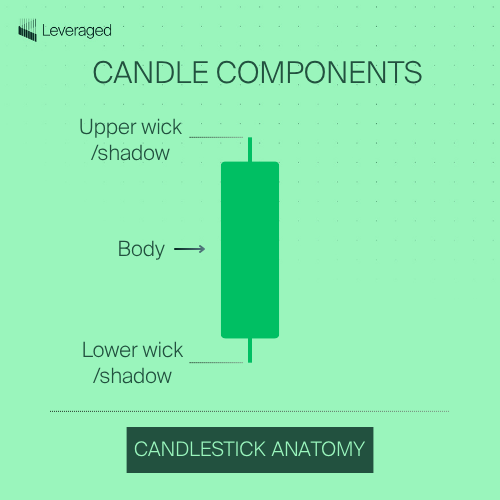
The second component are the Wicks (Shadows/Tails): These are the thin lines extending above and below the body. They represent the price extremes – the highest price and the lowest price reached during the period.
- Upper Wick/Shadow: The line above the body shows the highest price reached. A long upper wick suggests that buyers tried to push the price higher, but sellers ultimately pushed it back down.
- Lower Wick/Shadow: The line below the body shows the lowest price reached. A long lower wick indicates that sellers tried to drive the price lower, but buyers stepped in and pushed it back up.
Putting it All Together: A Quick Example
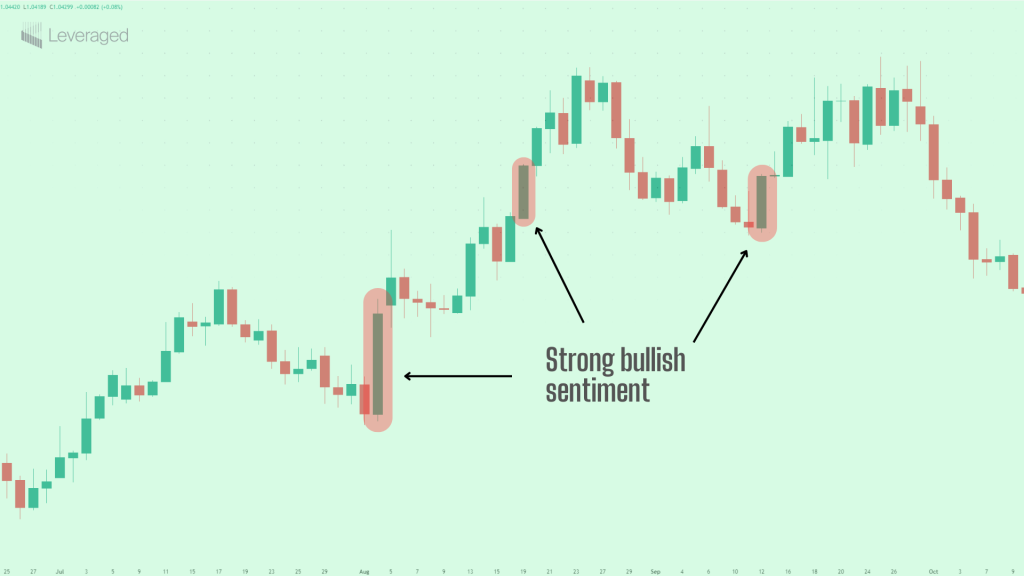
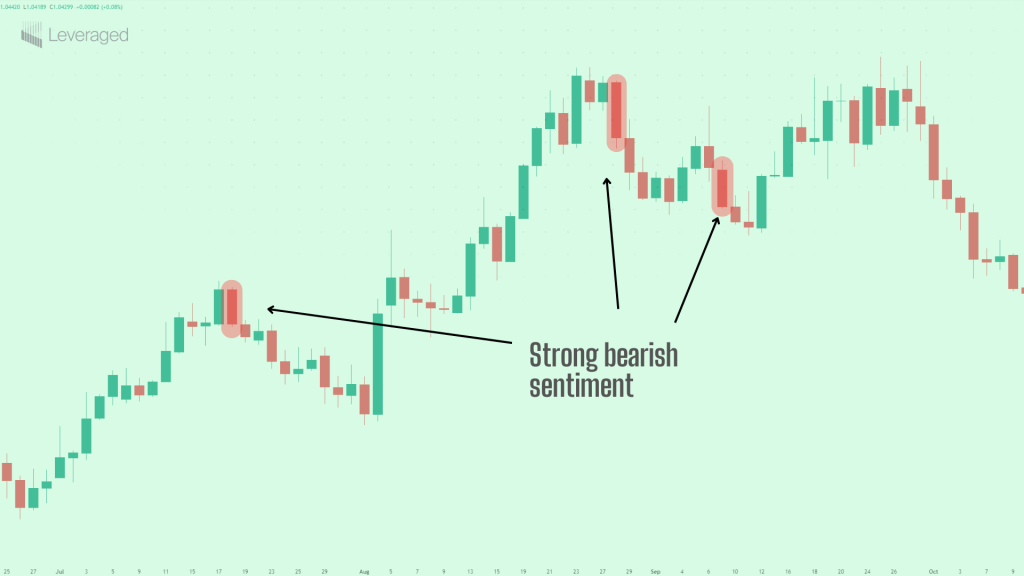
Imagine a candlestick with a long, green body and very small wicks. This tells you:
- Strong bullish sentiment: Buyers were overwhelmingly in control.
- Limited price fluctuation: The price didn’t move far from the open and close, indicating consistent buying pressure throughout the period.
Now, picture a candlestick with a small red body and a very long upper wick:
- Slightly bearish sentiment: Sellers slightly edged out buyers, but…
- Strong rejection of higher prices: Buyers initially pushed the price much higher, but sellers forcefully reversed that move. This could be a warning sign of a potential reversal.
Now that you understand the basics of a single candlestick, let’s see how these individual candles combine to form powerful price action patterns that can predict future price movements.
The Essential Pattern Playbook: Your Cheat Sheet Framework
Candlestick patterns are like the alphabet of trading – they form words, sentences, and ultimately, the story of market sentiment. But to read that story or the price action, you need to know how these patterns are organized. Mastering price action is crucial for success in any trading environment be it stock trading or forex trading, but especially when managing larger capital through a prop firm, and working towards a portfolio management role.
So, let’s break down the types of candlestick patterns and how they’re classified, so you can spot trading opportunities faster.
1. By Market Direction: Bullish, Bearish, or Neutral
The first way to categorize patterns is by what they suggest about the overall market direction, or the “mood” of the market participants:
- Bullish Candlestick Patterns: These patterns signal potential upswings, suggesting that the buyers (bulls) are gaining strength and the price might be heading higher. They often appear after a period of price decline, or during a temporary pullback within a larger uptrend. Examples you’ll learn about soon include the Hammer, Bullish Engulfing, and Morning Star.
- Bearish Candlestick Patterns: These patterns are a warning sign of potential downturns, typically form after a period of price increases, or during a brief rally within a larger downtrend. Examples include the Hanging Man, Bearish Engulfing, Tweezer Top, Gravestone Doji, and Evening Star.
- Neutral or Indecision Candlestick Patterns: Sometimes, the market is simply undecided. These patterns show a balance of power between buyers and sellers, with neither side gaining a clear advantage. These often look like candlesticks with small bodies and/or long wicks, representing a fierce battle with no clear winner.
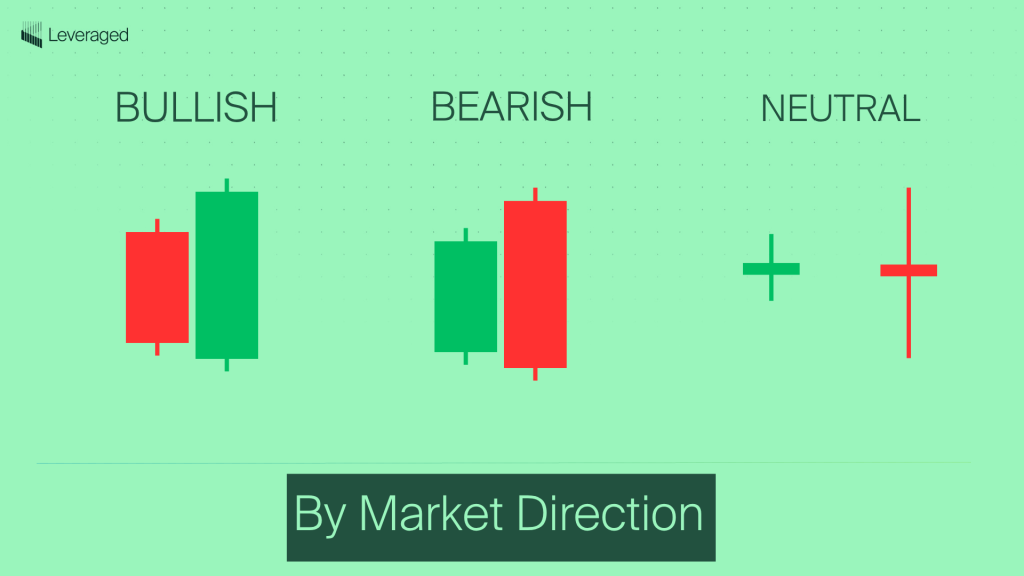
The classic example is the Doji (in three variations: gravestone, long-legged, and dragonfly), which looks like a plus sign or a cross. While neutral patterns don’t predict a direction on their own, they can be very important when they appear after a strong trend, potentially signaling a pause or a reversal. Other examples include:
- Spinning Top
- Long-legged Doji
- Rickshaw Man
- Inside Bar
- Harami
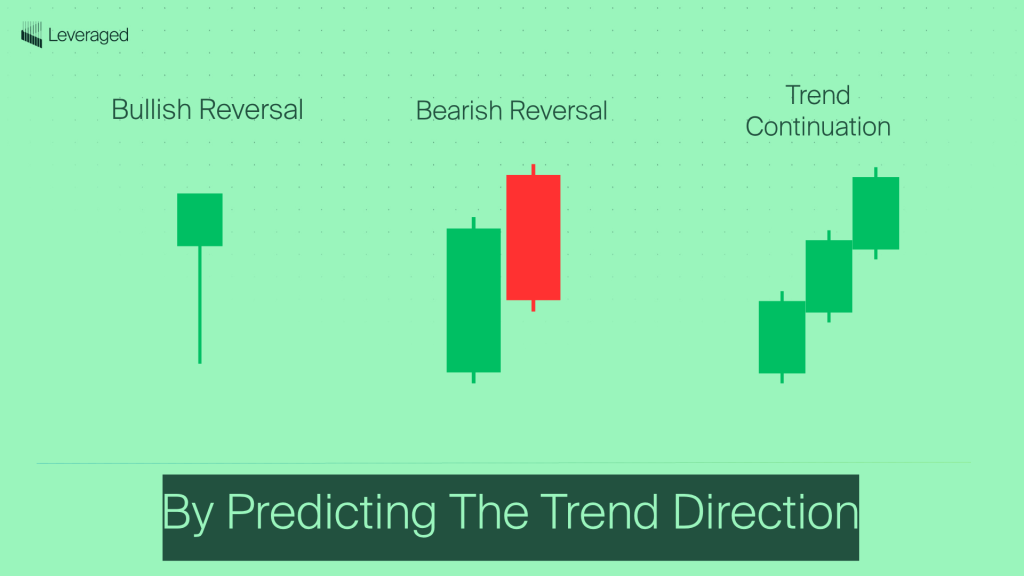
2. By Predicting the Trend’s Future: Reversal and Continuation Patterns
Another crucial way to classify patterns is by whether they suggest a change in the current trend or a continuation of it:
Reversal Candlestick Patterns: These patterns suggest that the prevailing trend (whether up or down) is losing momentum and might be about to reverse.
- Bullish Reversal Patterns: Signal a potential shift from a downtrend to an uptrend. (These overlap with the “Bullish” category above including Hammer, Piercing Pattern, Tweezer Bottom, or Inverted Hammer).
- Bearish Reversal Patterns: Signal a potential shift from an uptrend to a downtrend. (These overlap with the “Bearish” category above: Hanging Man, Tweezer Tops, Shooting Star or Pin Bar).
- Continuation Candlestick Patterns: These patterns signal that the current trend is likely to continue. They often appear during periods of consolidation or minor pullbacks within a larger trend.
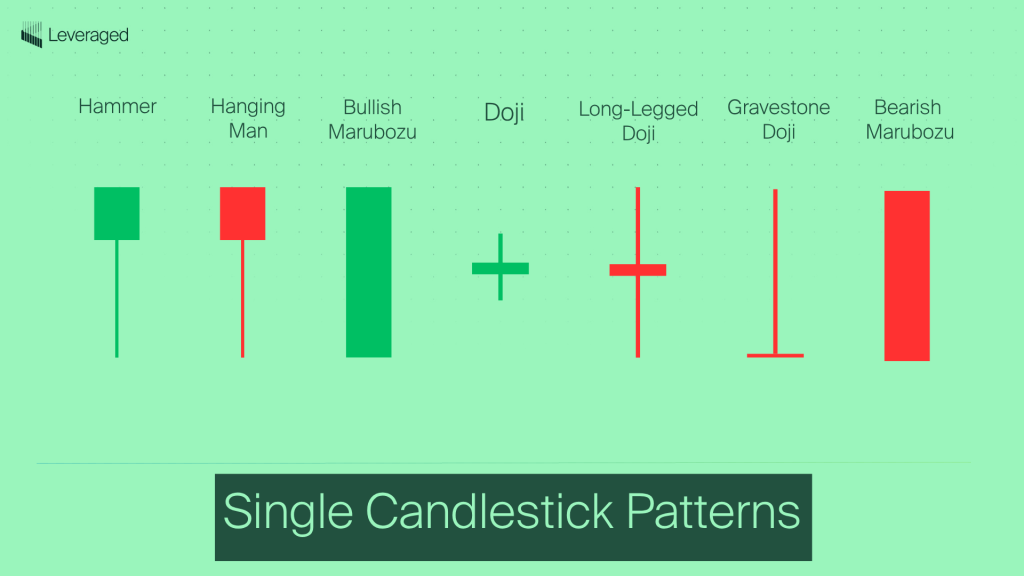
3. By Complexity: Single, Double, or Triple Bar Patterns
Finally, we can classify patterns by how many candlesticks they are composed of:
- Single Candlestick Patterns: Believe it or not, a single candlestick, all by itself, can be a powerful pattern! The Hammer, Hanging Man, bullish and bearish Marubozu, and Doji are all examples of single candlestick patterns.
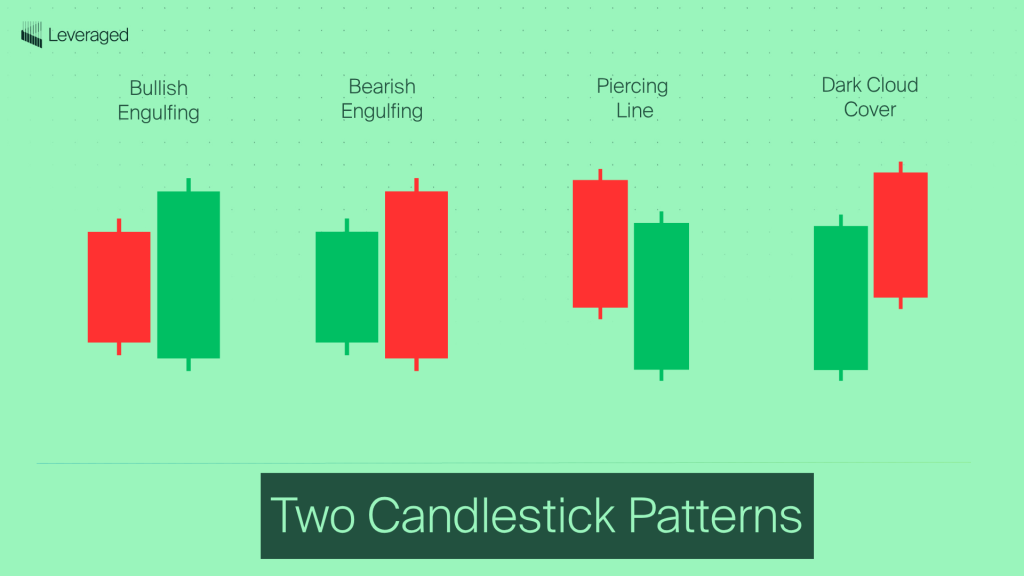
- Two-Candlestick Patterns: These patterns are formed by the relationship between two consecutive candlesticks. The size, position, and color of each candle relative to the other are key to interpreting the pattern. Examples include the Engulfing patterns (both Bullish and Bearish), Piercing Pattern, Tweezer Bottoms, Bullish Kicker, Dark-cloud cover and the bullish and bearish Harami patterns.
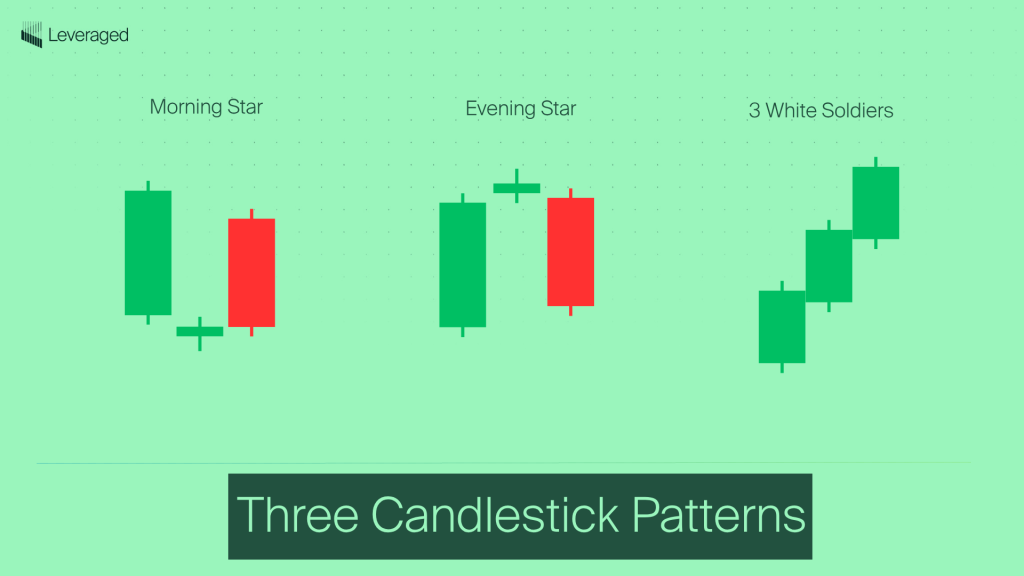
- Three-Candlestick Patterns: As the name suggests they are formed by three consecutive candlesticks, often providing stronger signals than single or dual patterns (though they tend to be less frequent). The Morning Star and Evening Star are classic examples. Other examples include the Three White Soldiers, Three Black Crows and the Bullish Abandoned Baby and Bearish Abandoned Baby.
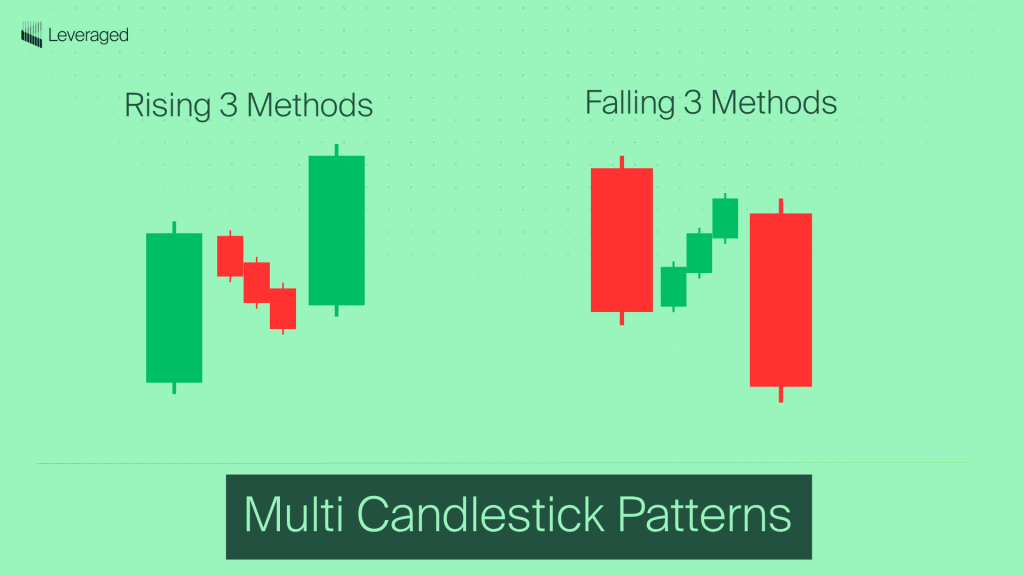
- Multi-Candlestick Pattern (More than three): There are some patterns that are formed by more than three candlesticks, like the Rising Three Methods and Falling Three Method or the Bullish and Bearish Three-Line Strike Candlesticks.
Moving from Theory to Practice: Using The Candlestick Cheat Sheet
It is important to see that a pattern can, and will normally fall, into all these categories. For example, a Morning Star candlestick pattern is a bullish pattern (market sentiment), a reversal pattern (trend implication) and three-Candlestick pattern (number of candlesticks) at the same time.
What’s next?
Now that you have a solid framework for understanding the different types of candlestick patterns, you’re ready to dive into the specifics! In the following sections, we’ll explore 10 of the most powerful and reliable candlestick patterns, complete with clear illustrations, explanations, success rates (where available), and practical examples.
Get ready to unlock the secrets of the market with your FREE candlestick patterns cheat sheet!
Candlestick Patterns Cheat Sheet PDF 2025
Now comes the exciting part! Here you will learn how to identify candlestick patterns and how to trade using candlestick patterns. These unique candlestick patterns identify specific patterns that can signal high-probability trading opportunities. Think of this as your practical field guide to the most important candlestick formations. This is the level of detail and understanding you’ll need to succeed in a prop trading environment. We’ll go in-depth, providing not just descriptions, but also insights into their psychology, trading implications, and even their historical success rates (with important caveats, of course!).
Hammer Candlestick Pattern
The Hammer is a single-candle pattern with a small body (either bullish or bearish) at the upper end of the trading range. It features a long lower shadow (at least twice the length of the body) and little to no upper shadow.
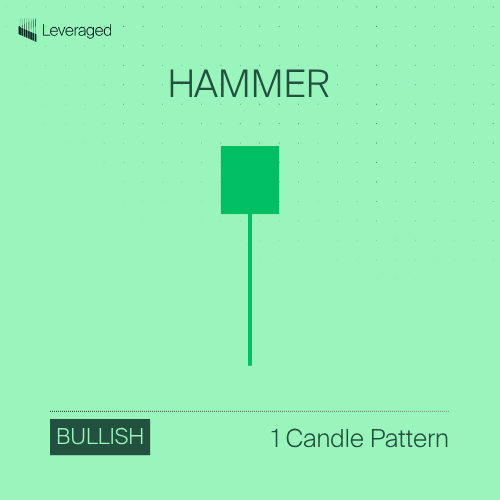
| Feature | Description |
| # Candles | 1 |
| Pattern Type | Reversal |
| Trend Direction | Bullish |
| Frequency | Relatively Common |
| Reliability | Medium to High |
| Location | After a downtrend |
| Ideal Entry | After Hammer close, with confirmation |
| Stop-Loss | Just below Hammer’s lower shadow |
| Profit Target | Based on Hammer size or other technical indicators |
| Success Rate | 60-70% (Bulkowski; with confirmation and in proper context) |
| Confirmation | Bullish candle after Hammer; increased volume |
| Occurrence Rate | ~2-5% (Estimated range) |
Hanging Man Candlestick Pattern
The Hanging Man is a one-candle pattern with a small body (either bullish or bearish) at the upper end of the trading range. A long lower shadow (at least twice the body’s length) and minimal to no upper shadow are present. It looks identical to the Hammer, but appears at the end of an uptrend.
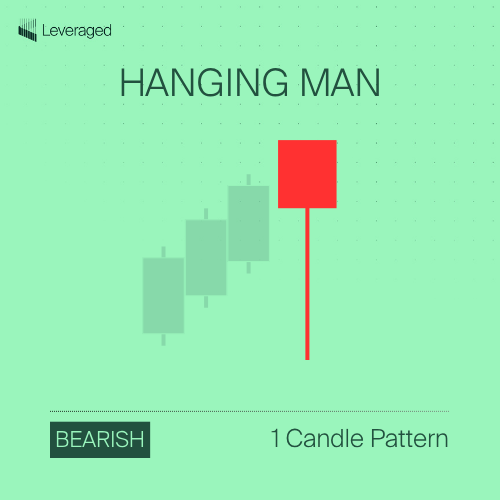
| Feature | Description |
| # Candles | 2 |
| Pattern Type | Reversal |
| Trend Direction | Bullish |
| Frequency | Relatively Common |
| Reliability | High |
| Location | After a downtrend |
| Ideal Entry | After close of second (engulfing) candle |
| Stop-Loss | Below low of second (engulfing) candle |
| Profit Target | Using Fibonacci, resistance, or other indicators |
| Success Rate | 70-80% (Bulkowski; well-formed, in clear downtrend) |
| Confirmation | Higher close next candle |
| Occurrence Rate | ~0.5-3% (Estimated range) |
Bullish Engulfing Candlestick Pattern
This is a two-candle pattern where the second candlestick completely “engulfs” the body of the first candle. The first candle is red, while the second candle is green.
| Feature | Description |
| # Candles | 2 |
| Pattern Type | Reversal |
| Trend Direction | Bullish |
| Frequency | Relatively Common |
| Reliability | High |
| Location | After a downtrend |
| Ideal Entry | After close of second (engulfing) candle |
| Stop-Loss | Below low of second (engulfing) candle |
| Profit Target | Using Fibonacci, resistance, or other indicators |
| Success Rate | 70-80% (Bulkowski; well-formed, in clear downtrend) |
| Confirmation | Higher close next candle |
| Occurrence Rate | ~0.5-3% (Estimated range) |
Bearish Engulfing Candlestick Pattern
The bearish engulfing is a two-candle pattern where the second candle is a large bearish candle that completely “engulfs” the body of the first candle.
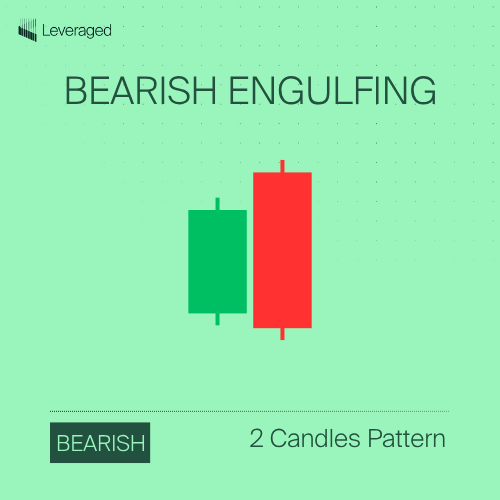
| Feature | Description |
| # Candles | 2 |
| Pattern Type | Reversal |
| Trend Direction | Bearish |
| Frequency | Relatively Common |
| Reliability | High |
| Location | After an uptrend |
| Ideal Entry | After the close of the second (engulfing) candle |
| Stop-Loss | Above the high of the second (engulfing) candle |
| Profit Target | Using Fibonacci, support, or other indicators |
| Success Rate | 65-78% (Bulkowski; well-formed, in clear uptrend) |
| Confirmation | Lower close on the next candle |
| Occurrence Rate | ~0.5-3% (Estimated) |
Morning Star Candlestick Pattern
The Morning Star is a three-candle pattern.
- Candle 1: A long bearish candle, continuing the downtrend.
- Candle 2: A small-bodied candle like a Doji that gaps down from the first candle.
- Candle 3: A long bullish candle that gaps up from the second candle and closes at least halfway into the body of the first candle.
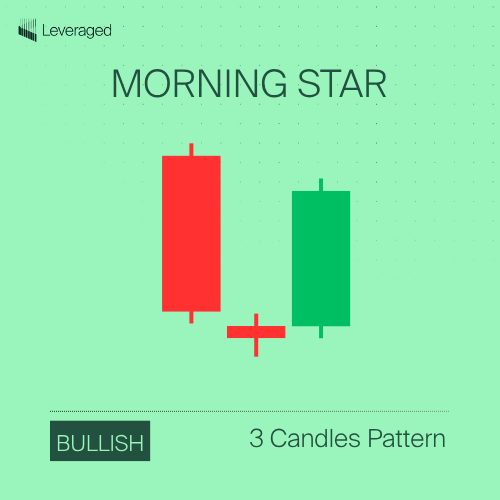
| Feature | Description |
| # Candles | 3 |
| Pattern Type | Reversal |
| Trend Direction | Bullish |
| Frequency | Less Common |
| Reliability | High |
| Location | After a downtrend |
| Ideal Entry | After the close of the third (bullish) candle |
| Stop-Loss | Below the low of the second (small) candle |
| Profit Target | Based on resistance levels or other technical indicators |
| Success Rate | 70-79% (Bulkowski; well-formed patterns) |
| Confirmation | Higher close on the candle after the pattern |
| Occurrence Rate | ~0.2-1% (Estimated) |
Evening Star Candlestick Pattern
The Evening Star is a three-candle pattern and is the opposite of the Morning Star candlestick pattern. A long bullish followed by a small-bodied candle and lastly a long bearish candle.
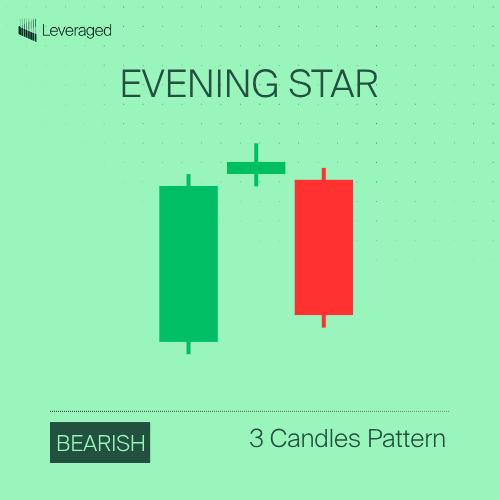
| Feature | Description |
| # Candles | 3 |
| Pattern Type | Reversal |
| Trend Direction | Bearish |
| Frequency | Less Common |
| Reliability | High |
| Location | After an uptrend |
| Ideal Entry | After the close of the third (bearish) candle |
| Stop-Loss | Above the high of the second (small) candle |
| Profit Target | Based on support levels or other technical indicators |
| Success Rate | 68-75% (Bulkowski; well-formed patterns) |
| Confirmation | Lower close on the candle after the pattern |
| Occurrence Rate | ~0.2-1% (Estimated) |
Doji Candlestick Pattern
The Doji is a one-candle pattern with the open and close price very close or the same.
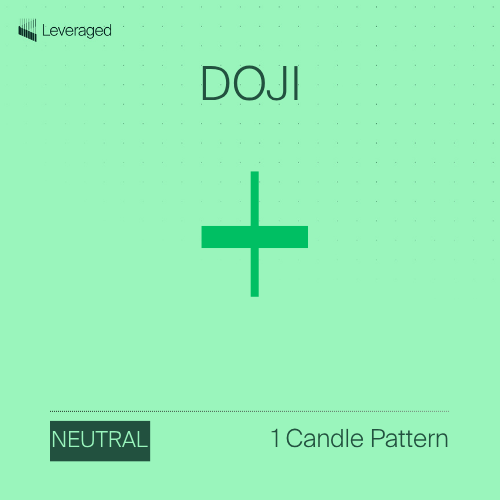
| # Candles | 1 |
| Pattern Type | Indecision (can be part of reversal or continuation) |
| Trend Direction | Neutral (context-dependent) |
| Frequency | Common |
| Reliability | Low on its own; Very High as part of a larger pattern |
| Location | Significance increases after a strong, extended trend |
| Ideal Entry | Never trade a Doji in isolation. Wait for confirmation |
| Stop-Loss | Depends on the confirming pattern/setup |
| Profit Target | Depends on the confirming pattern/setup |
| Success Rate | Highly variable; meaningless in isolation |
| Confirmation | Essential. Strong move in either direction after the Doji |
| Occurrence Rate | ~3-10% (Estimated; very common, but most are insignificant) |
Bonus Candlestick Patterns
Piercing Line Candlestick Pattern
The Piercing line is a two-candle pattern:
- Candle 1: A long bearish candle.
- Candle 2: A bullish candle that opens below the close of Candle 1 (a gap down) but closes above the midpoint of Candle 1’s body.
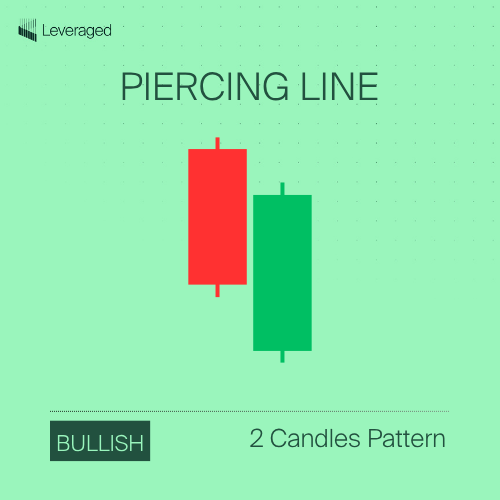
| # Candles | 2 |
| Pattern Type | Reversal |
| Trend Direction | Bullish |
| Frequency | Less Common |
| Reliability | Medium |
| Location | After a downtrend |
| Ideal Entry | After close of Candle 2, with confirmation |
| Stop-Loss | Below the low of Candle 2 |
| Profit Target | Based on resistance or other indicators |
| Success Rate | ~55-65% (Bulkowski; with confirmation) |
| Confirmation | Bullish candle after the pattern |
| Occurrence Rate | ~0.3-1.5% (Estimated) |
Dark Cloud Cover Candlestick Pattern
The Dark Cloud Cover is a two-candle pattern:
- Candle 1: A long bullish candle.
- Candle 2: A bearish candle that opens above the close of Candle 1 (a gap up) but closes below the midpoint of Candle 1’s body.
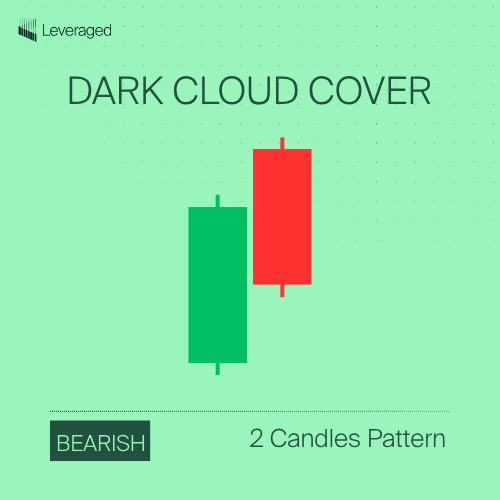
| Feature | Description |
| # Candles | 2 |
| Pattern Type | Reversal |
| Trend Direction | Bearish |
| Frequency | Less Common |
| Reliability | Medium |
| Location | After an uptrend |
| Ideal Entry | After close of Candle 2, with confirmation |
| Stop-Loss | Above the high of Candle 2 |
| Profit Target | Based on support or other indicators |
| Success Rate | ~50-62% (Bulkowski; with confirmation) |
| Confirmation | Bearish candle after the pattern |
| Occurrence Rate | ~0.3-1.5% (Estimated) |
Three White Soldiers Candlestick Pattern
The 3 White Soldiers is a three-candle formation formed by three consecutive long bullish candles. Ideally, each candle opens within the previous candle’s real body and each candle closes near its high, showing strong, consistent buying pressure. The opposite of the 3 White Soldiers is the Three Black Crows, which is a 3-bar pattern that signals bearish continuation.
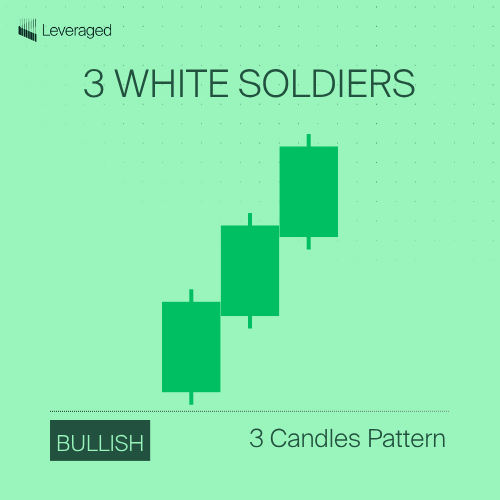
| Feature | Description |
| # Candles | 3 |
| Pattern Type | Reversal |
| Trend Direction | Bullish |
| Frequency | Rare |
| Reliability | High |
| Location | After a downtrend or consolidation |
| Ideal Entry | After the close of the third candle (be cautious of overextension) |
| Stop-Loss | Below the low of the first or second candle |
| Profit Target | Based on resistance levels or measured moves |
| Success Rate | 75-85% (Bulkowski; well-formed patterns) |
| Confirmation | Higher close on subsequent candles, high volume |
| Occurrence Rate | <0.1-0.5% (Estimated; quite rare) |
Note on Occurrence Rate: It’s very difficult to give a precise, universally applicable “Occurrence Rate” for candlestick patterns because it varies wildly between different markets (stocks, commodities, forex and cryptocurrencies) and different timeframes.
Ready to Master the Candlestick Patterns?
Imagine having a free cheat sheet that organizes these patterns into a clear, visual roadmap—with their historical success rates and a bonus chart to ID them at a glance. Grab your FREE candlestick patterns cheat sheet PDF and start trading like a pro!
Top 3 Common Mistakes When Using Candlestick Patterns
You’ve learned the anatomy of candlesticks, understood the different types of patterns, and you’re eager to start spotting them on your charts. That’s fantastic! But before you jump in, it’s vital to be aware of some common mistakes and common pattern traps to avoid that can lead to misinterpretations and potentially costly trading strategy errors. These mistakes are even more critical to avoid when trading with a prop firm’s capital. Think of this section as your “safety guide to candlestick patterns cheat sheet:”
- Ignoring the Trading Context: The single biggest mistake is treating candlestick patterns in isolation and ignoring the overall market context and trend.
- Seeing Patterns That Aren’t There: Trying to fit a candlestick formation into a predefined pattern when it doesn’t truly meet the criteria. For example, stretching the definition of a “hammer” to include candlesticks that don’t have a sufficiently long lower wick.
- Over-Reliance on Single Candlesticks: While single candlestick patterns (like the Doji or Hammer) can be powerful, relying solely on them without confirmation is risky. Pro tip: A single candlestick might be a fleeting blip in the market, not a genuine shift in sentiment.
You’ve now gained a solid foundation in candlestick pattern analysis – a crucial skill for any serious Forex trader. But knowledge alone isn’t enough, you also need the capital and the support to put your pattern recognition skills to the test. Ready to take your trading to the next level and trade with significant capital? Leveraged offers aspiring traders like you the opportunity to prove their skills and manage substantial funds up to $1 million and keep 80% of the profits. Our proprietary simulation is designed to identify talented traders who can consistently generate profits.
Click the button below and start your journey of becoming Leveraged Portfolio Manager.
FAQ
How reliable are candlestick patterns in trading?
The most reliable candlestick patterns can achieve a success rate of 60-80% but even with this level of accuracy, candlestick patterns indicate probabilities, not guarantees.
What are the best candlestick patterns for beginners?
Beginners should focus on straightforward and frequently occurring patterns like hammers, engulfing candles, inside bars and Doji stars.
How do I know if a pattern is valid?
Validate with the TRUST Framework:
- Trend Alignment: Does the pattern match the broader trend?
- Volume Surge: Is there a spike in volume to confirm the move?
- Support and Resistance: Does the pattern form near key price levels?
- Timeframe Consensus: Do multiple timeframes (e.g., daily + 4-hour) agree?
What is the best timeframe for trading candlestick patterns?
Daily charts are often ideal as they balance signal clarity and noise reduction. However, the best timeframe depends on your trading style:
- Day traders may prefer 5-minute or 15-minute charts.
- Swing traders typically use daily or weekly charts.
Can AI or trading bots replace candlestick pattern analysis?
Yes, AI can quickly scan and identify patterns, but human traders are still needed for overall trading strategy and risk management. Leveraged AI tools automate pattern recognition, saving you time and increasing your market coverage. Our AI scans for patterns in real-time, giving you an unfair advantage in the market.
What are the benefits of joining a prop firm like Leverage?
Leveraged provides aspiring traders with advanced AI tools and elite education and capital to become successful traders, allowing you to Leverage your skill into profits.