How 278 Trades Led to a $6,802 Payout
In this edition of Leveraged Success Stories, we add a grounded chapter to our archive of trader success stories by looking at a trader who proves that trading isn’t always about hitting “home runs.” Sometimes, it’s about showing up every day, grinding through the noise, and letting the law of large numbers work in your favor. Trading on a $100,000 Funded Turbo account, this trader navigated a rocky start to generate a Total Profit of $8,503 – all done over the course of 17 trading days. The reward for this intense grind? A profit share payout of $6,802.
The Journey: Surviving the Drawdown
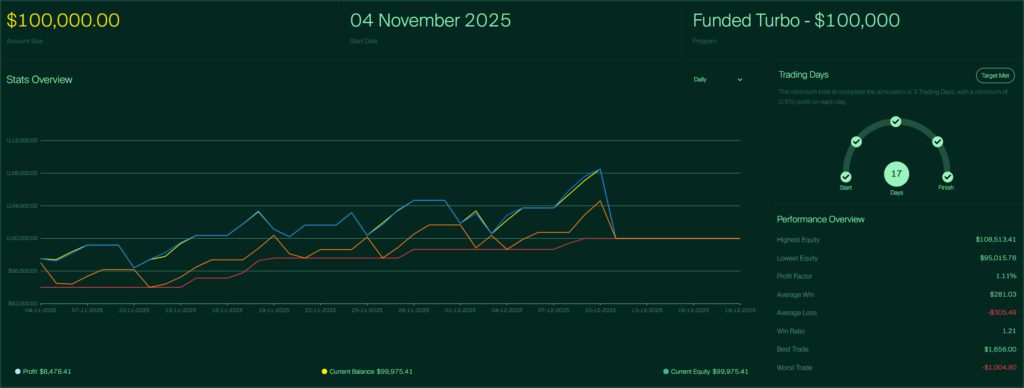
Unlike the “straight line up” charts we often see – such as the 73% Win Rate Gold Scalper we recently profiled – this Equity Curve tells a familiar – but often overlooked – success story. Rather than sharp spikes or deep drawdowns, the account progressed through measured gains and controlled pullbacks, staying comfortably within risk limits throughout the entire period. This kind of balance is exactly what allows traders to stay in the game long enough for consistency to pay off. Looking at the chart from November 4 to November 14, the trader immediately fell into a drawdown, with the account equity dropping as low as $95,015.76 (a 5% loss). Many traders give up here. They panic, over-leverage, and blow the account.
This trader did the opposite. They kept their cool, stuck to their trading strategy, and slowly clawed their way back above the $100k waterline. By early December, the account broke out, peaking over $108,000 before the withdrawal was processed.
The Mathematics: The “Casino” Approach
This trader’s statistics reveal a very specific style: scalping, low margin trading. At first glance, the statistics may look modest – but taken together, they reveal a clear trading edge:
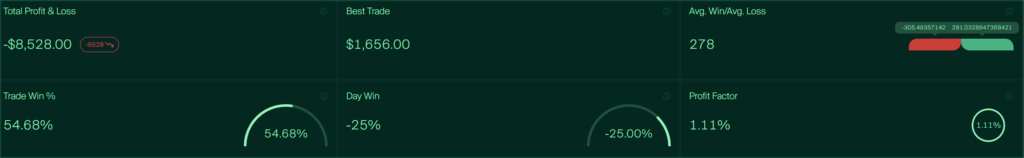
- Trades Executed: 278
- Win Rate: 54.68%
- Profit Factor: 1.11
- Avg Win: $281.03
- Avg Loss: -$305.49
The Reality Check: With a Profit Factor of 1.11 and an Average Loss slightly larger than the Average Win, this trader was walking a tightrope. Their edge was razor-thin. However, because they maintained a 54% Win Rate over a massive sample size (278 trades), that tiny edge compounded into $8,500 in profit. This is the “Casino” approach: having a small edge but playing the game enough times to ensure the house wins.
Visualizing the Grind: Inside the Trading Calendar
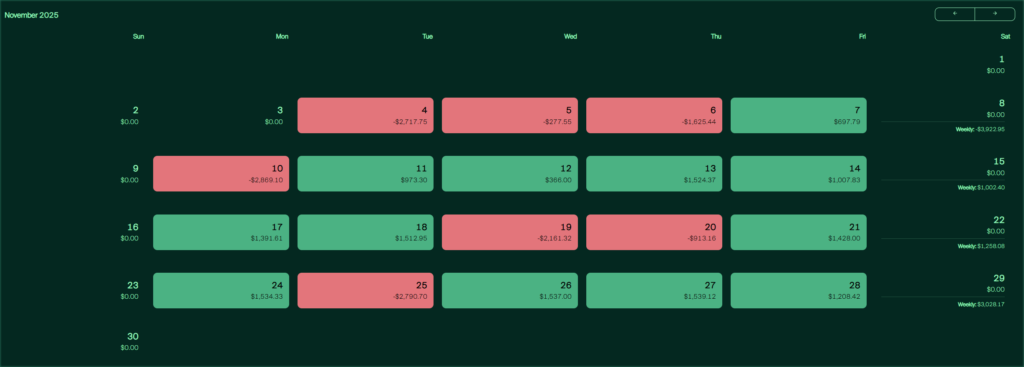
With our newly updated Trader’s Dashboard, we can now break down the daily performance to see exactly how this recovery happened. By breaking down the performance by week and day, we uncover a pattern that every trader should look for in their own data. This trader’s profitability wasn’t random; it was highly dependent on the day of the week.
Best Week vs. Worst Week
- The Worst Week (Nov 2 – Nov 8): The trader started the month with a disaster, ending the week down -$3,922.95. This nearly cost them the account right out of the gate.
- The Best Week (Dec 7 – Dec 13): The redemption arc peaked in the second week of December. The trader recorded four consecutive green days, generating a significant $4,768.00 in profit. This week alone accounted for more than half of the final profit share.
Day of the Week Analysis
The most striking insight comes from looking at individual trading days. All of the trader’s massive losses occurred at the start of the trading week (Monday and Tuesday). The trader seemingly struggled to sync with the market opening flow, often digging a hole early in the week that they had to spend the rest of the week digging out of that drawdown. Contrary to the popular belief that “Fridays are for amateurs,” Friday was this trader’s most consistent trading day of the week. Every single active Friday was profitable. While many traders give back profits at the end of the week, this trader used Fridays to secure the bag. Whether due to lower liquidity or specific mean-reversion setups, Friday was their statistical safe haven.
One pattern we see across many trader success stories is self-awareness. If this trader had simply not traded on Mondays, they would have avoided their two biggest drawdowns. Review your journal: is there a specific day where you consistently lose money? If so, consider reducing your position size – or taking the day off entirely – on that day. This data proves that a bad start to the week doesn’t define the week. This trader frequently started in the red (Mon/Tue) but stayed disciplined enough to capitalize on their “Golden Fridays.” Resilience is about staying in the game long enough to reach your high-performance trading days.
Asset Choice: The Forex & Gold Mix
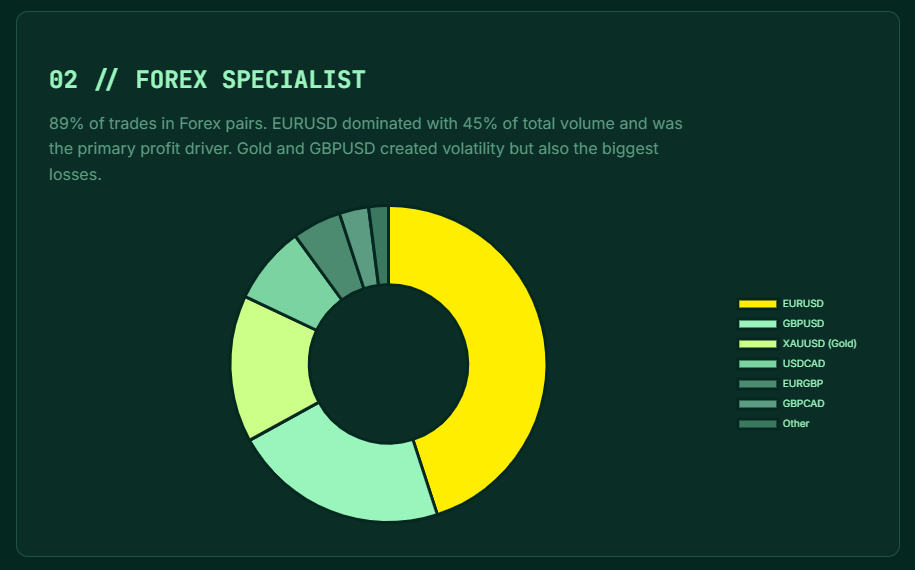
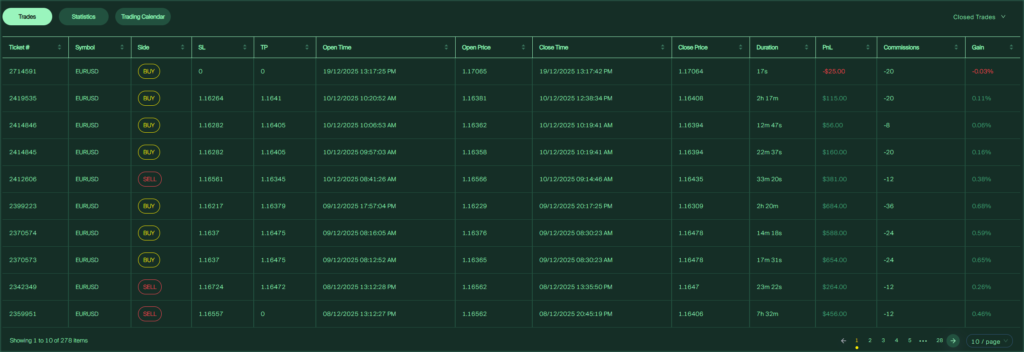
Unlike the previous trader who was a “Market Rover” trading Crypto, Metals, and Oil, this trader is a Forex Specialist with a secondary focus on Gold. A review of the trading logs shows a trading strategy built on order stacking across major Forex pairs – particularly EURUSD, GBPUSD and Gold.
- Instruments: Heavily traded EURUSD, GBPUSD, and USDCAD, with occasional volatility plays on XAUUSD (Gold).
- Style: The trader often opened multiple trading positions (e.g., Tickets 1937330, 1937331, 1937332). This “layering” technique allows them to scale into a move and exit granularly.
Trades were held anywhere from just a few minutes to several hours, placing this trader somewhere between active intraday trading and short-term scalping. Importantly, there was no directional bias. The trader executed both long and short positions depending on market structure, reacting to price behavior rather than forcing trades in one direction. This flexibility is often a key difference between traders who survive drawdowns and those who don’t.
The “Double-Edged Sword”
A deep dive into the trade logs reveals a massive disparity in performance across instruments. This trader is a Forex Specialist who occasionally flirted with danger in Gold and Cable (GBPUSD).
- The Cash Cow (EURUSD): This was the undeniable star of the portfolio. The win rate was high, and losses were strictly managed in the $200–$400 range. The biggest wins ($1,656 and $856) all came from the Euro (EUR/USD).
- The Hidden Gems (Currency Crosses): While traded less frequently, GBPCAD and EURGBP were highly efficient, providing consistent wins (e.g., +$703 and +$765) with minimal drawdown.
- The Anchors (Gold & GBPUSD): These two instruments were the source of the portfolio’s volatility. While they produced some wins, they were also responsible for the heaviest losses, including single-trade hits of -$1,004 on Gold and -$840 on GBPUSD.
The Takeaway: The trader essentially used their mastery of EURUSD to fund their tuition in Gold and Pound volatility. Had they cut the underperformers and stuck to their A-Game (Euro), the profit factor likely would have been significantly higher, perhaps rivaling the Profit Factor 4.05 we saw in our Bitcoin/Gold feature.
The Strategy: Intraday Trend Trading
While the high trade count suggests scalping, the trade durations tell a different story. This trader is an Intraday Trend Trader with a preference for the London and New York Opens.
- Duration: Winning trades were typically held for 1 to 3 hours, riding the session momentum.
- No Bias: Importantly, there was no directional bias. The trader executed both long and short positions depending on market structure, reacting to price behavior rather than forcing a view.
A Consistent Risk Model
One of the most impressive aspects of this performance is how uniform the trade sizing and risk exposure remained throughout the entire cycle. Most winning trades clustered in a similar profit range, showing that the trader wasn’t chasing outsized wins or increasing lot sizes emotionally. Losses were kept small and predictable, and even during brief losing streaks, there was no sign of revenge trading or overexposure. The trader respected daily limits and allowed the statistical edge to play out naturally.
Case Study: The 2-Hour EURUSD Slide (+$1,656)
On December 4, right as the account was recovering from drawdown, the trader caught their best move of the cycle. The trader’s best trade, a $1,656 winner, reflects the overall approach perfectly. Rather than holding for an extreme move, the position was managed efficiently, capturing a clean portion of market momentum before exiting.
- Ticket: #2252406
- Asset: EURUSD (Sell)
- Result: +$1,656.00
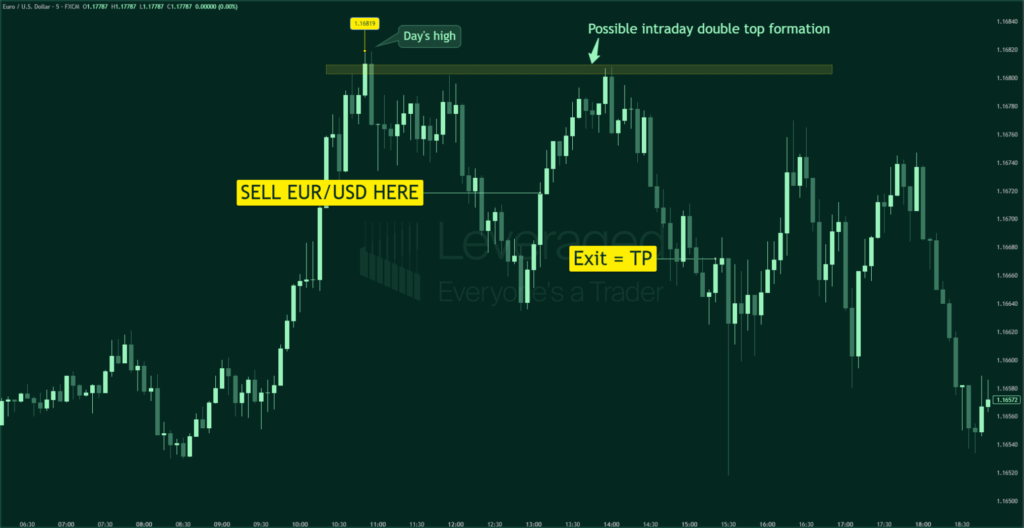
The Setup: The trader shorted the Euro at 1.16715 just after the London session established a direction. Unlike their usual quick scalps (which often lasted minutes), they held this position for 2 hours and 21 minutes. They covered the short at 1.16527, capturing a clean trend continuation. This single trade provided a massive cushion, covering roughly 5 to 6 of their average losses and propelling the equity curve into safe territory. This kind of trade may not grab headlines, but repeated execution of trading setups like this is exactly what builds a reliable equity curve – and ultimately, a payout.

The Disciplined Counter-Trend Short – The Execution
This trade is a perfect example of discipline and knowing when to exit. The macro trend for EURUSD was bullish, with price pulling back from the 2025 highs. Despite the prior day being up, the trader identified an intraday weakness during the London session and took a counter-trend short.He held the trade through the London session and closed it just 30 minutes after the New York open. Why is this exit significant? He closed the trade right before a High-Impact News Event. Even though the trade was profitable, he respected the Leveraged “No News Trading” rule to avoid slippage or volatility spikes. This discipline locked in the profit before the market became unpredictable.
The “Worst” Trade: Gold Volatility Bites
To understand the psychology of trading, we must look at the biggest loss too. While the trader excelled in Forex, Gold proved to be a dangerous asset for his trading account equity curve.
- Ticket: #1827630
- Asset: XAUUSD (Sell)
- Result: -$1,004.90
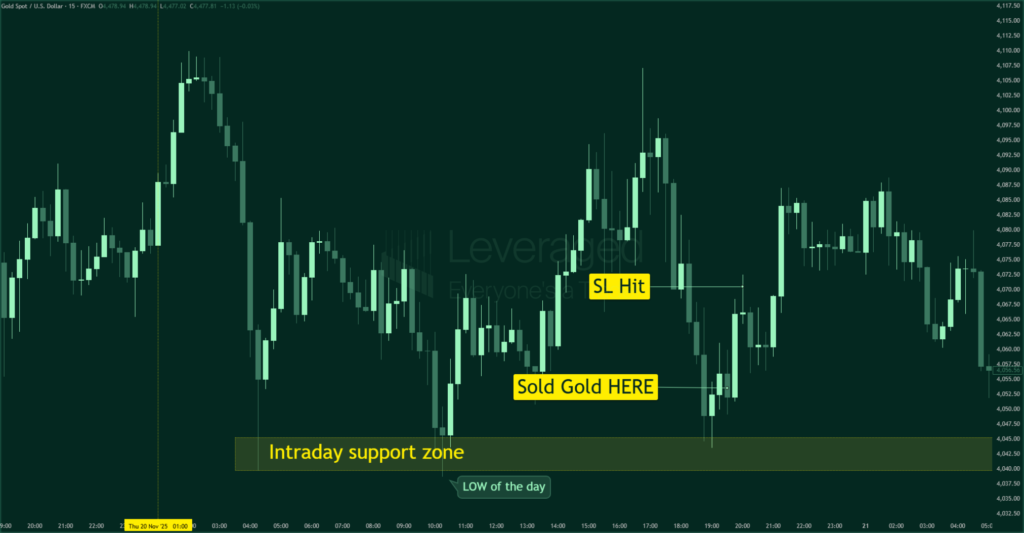
The Analysis: On November 20, the trader shorted Gold at 4054.67. In just 32 minutes, the price ripped against them to 4070.09. Because Gold is so much more volatile than currencies like EURUSD, the same lot size resulted in a loss roughly 3x larger than their average loss. This trade serves as a reminder: when switching asset classes, you must adjust your position size to account for volatility. Furthermore, the logs show the trader holding losing positions on GBPUSD for up to 13 hours, while winners were cut in 2 hours. This “holding and hoping” on volatile pairs is the primary reason for the negative Risk-to-Reward ratio.

The Context – The “House Money” Effect:
The trader started the NY session hot, banking $1,750 in profits across two winning trades. Feeling confident (and perhaps flush with “house money”), he decided to press his luck. 30 minutes after closing his wins, he entered a new short on Gold – but this time, he tripled his position size. He was shorting into a cyclical bullish trend on Gold. Worse, he sold right into a key intraday support zone ($4,044 – $4,040), anticipating a breakout that never came. Support held, and price ripped against him. Because he had tripled his size, the reversal caused a $1,000 loss in minutes, wiping out a huge chunk of his earlier gains.
What Traders Can Learn
- It’s Not Over Until You Hit the Limit: This trader was down 5% – halfway to losing the account. They didn’t quit. They recovered and withdrew $6,800. Resilience pays.
- Volume Can Compensate for Edge: You don’t need a 4.0 Profit Factor to make money – like our previous successful prop trader featured HERE. You don’t need a perfect trading strategy to make money, but if you have a small edge (1.11 PF) and the discipline to execute it hundreds of times without tilting, you can still be profitable.
- Watch Your Average Loss: This trader had a “Negative Risk-Reward Ratio” (Avg Loss > Avg Win). While they succeeded due to a high win rate, this is a stressful way to trade. Improving the RRR to 1:1 would have likely doubled their profits with the same effort.
- Identify Your “A-Game”: This trader is a Euro master but a Gold novice. Analyzing your own stats to cut out the underperforming assets (Gold/GBPUSD) and doubling down on the winners (EURUSD/GBPCAD) is the fastest way to double your profitability.
- Beware the “Winner’s Tilt”: Winning can be as dangerous as losing. After banking $1,750, the trader got overconfident and tripled his lot size. Treat every trade as independent; don’t increase risk just because you won the previous trade.
Conclusion
This addition to our trader success stories reinforces an important lesson: you don’t need perfection to be profitable – you need consistency. This story is for the grinders – the traders who battle the markets every single day for every inch of profit. It wasn’t the prettiest equity curve, and the stats weren’t perfect, but the result is undeniable: A $6,802 payout. It’s another strong reminder that in funded trading, longevity beats intensity, and traders who respect the process and have a proven trading strategy are the ones who get paid. At Leveraged, we fund results, not just “perfect” charts.
Disclaimer: The analysis provided in this article is based on a retrospective look at the charts and represents the personal opinion of the author. At Leveraged, we do not dictate specific trading strategies. Our traders maintain full autonomy over their trading style and decisions, provided they operate within our Risk Management parameters and Terms & Conditions.